
Founder & CEO, Devot AI
A multi-domain Data Scientist and Software Engineer specializing in NLP, Large Language Models, and scalable AI systems. Aviral leads Devot AI with a focus on building production-ready solutions that solve complex business challenges.
Most organizations don’t fail at prediction—they fail at reliability. The difference is the stack around the model. This guide lays out how to build a modern, governed infrastructure for ai forecasting that survives audits, scale, and constant change.
Summary
This guide translates ai forecasting from standalone models into a governed, end-to-end system. It details the data, orchestration, and control points that move forecasts from lab to production without regressions. It shows how approval gates, backtesting, registries, and monitoring tie directly to service levels and financial outcomes. It also clarifies where LLM-derived signals fit without compromising traceability or cost. The focus stays on repeatability, latency budgets, and long-term maintainability.
Introduction
Planning cycles are shorter, supply chains are more volatile, and data arrives from everywhere—transaction systems, sensors, and external feeds. In this environment, ai forecasting matters because decisions hinge on timely, well-governed predictions that can be explained, audited, and scaled across product lines and geographies. What worked as a desktop model breaks under operational load: you need reproducible pipelines, policy enforcement, controlled deployment, and clear ownership. This article focuses on the governance and infrastructure that make AI forecasting dependable in production, now that modern data stacks and LLM-derived signals are widely available.
Understanding the Topic
AI forecasting is the disciplined practice of producing reproducible, probabilistic predictions of future metrics using statistical, machine learning, deep learning, and (optionally) LLM-derived signals—operated under enterprise governance with defined SLAs and audits.
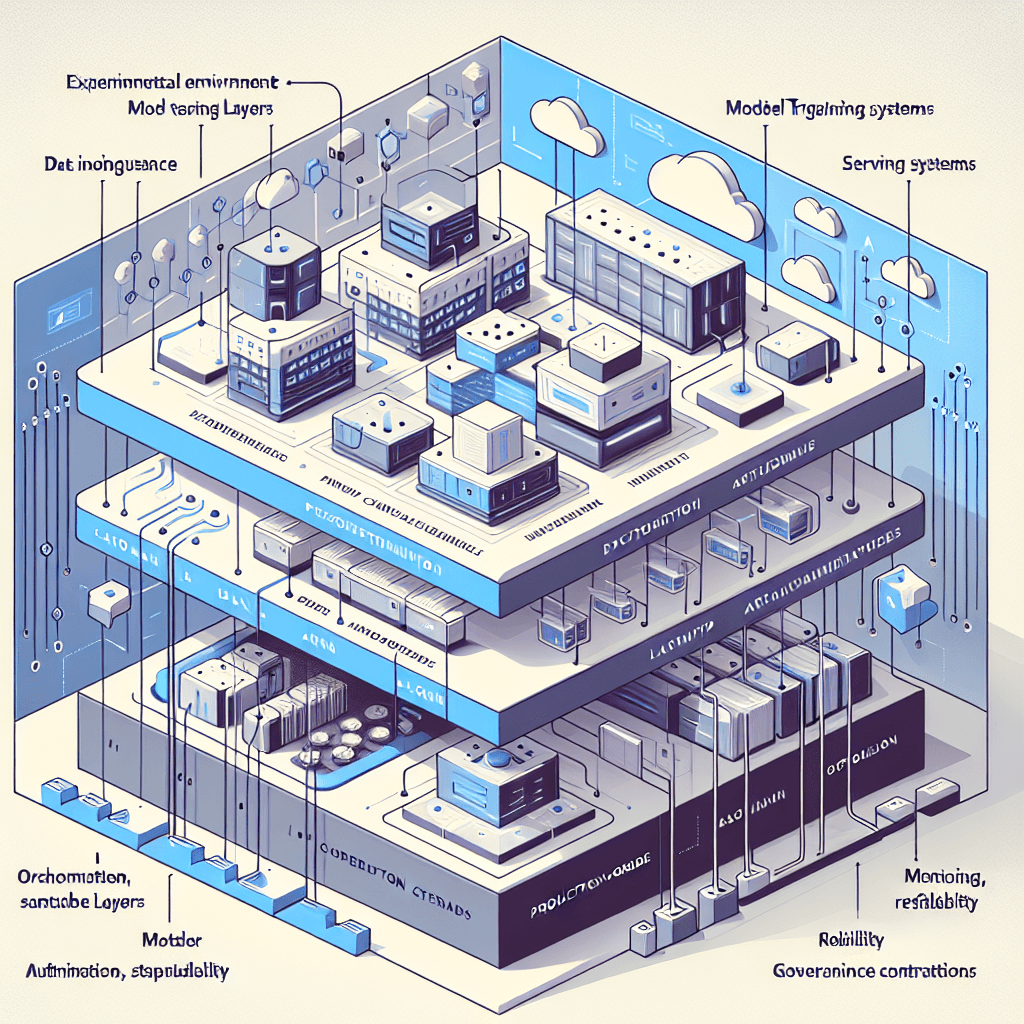
In enterprise contexts, this means: forecasts are not spreadsheets or notebooks; they are versioned assets with lineage from source data to deployed model, with defined controls. The stack must handle variable horizons (hours to quarters), multiple hierarchies (SKU, region, channel), uncertainty intervals, and strict latency/throughput budgets. Governance standards (RBAC, approvals, model cards, audit trails) and infrastructure (orchestration, feature stores, registries, monitoring) turn a good model into a reliable service.
Beginner-friendly way to see it without oversimplifying: forecasts are only as trustworthy as the weakest link in the pipeline. If data quality checks, backtests, and deployment controls are inconsistent, the outputs will be too. If you capture lineage, validate data, evaluate using rolling backtests, and deploy via registries with approvals, you can scale from one product line to hundreds without losing control. LLMs are useful for extracting structured signals from unstructured text or generating scenario narratives, but the forecasting core still demands explicit evaluation and traceable features.
How This Works in Practice
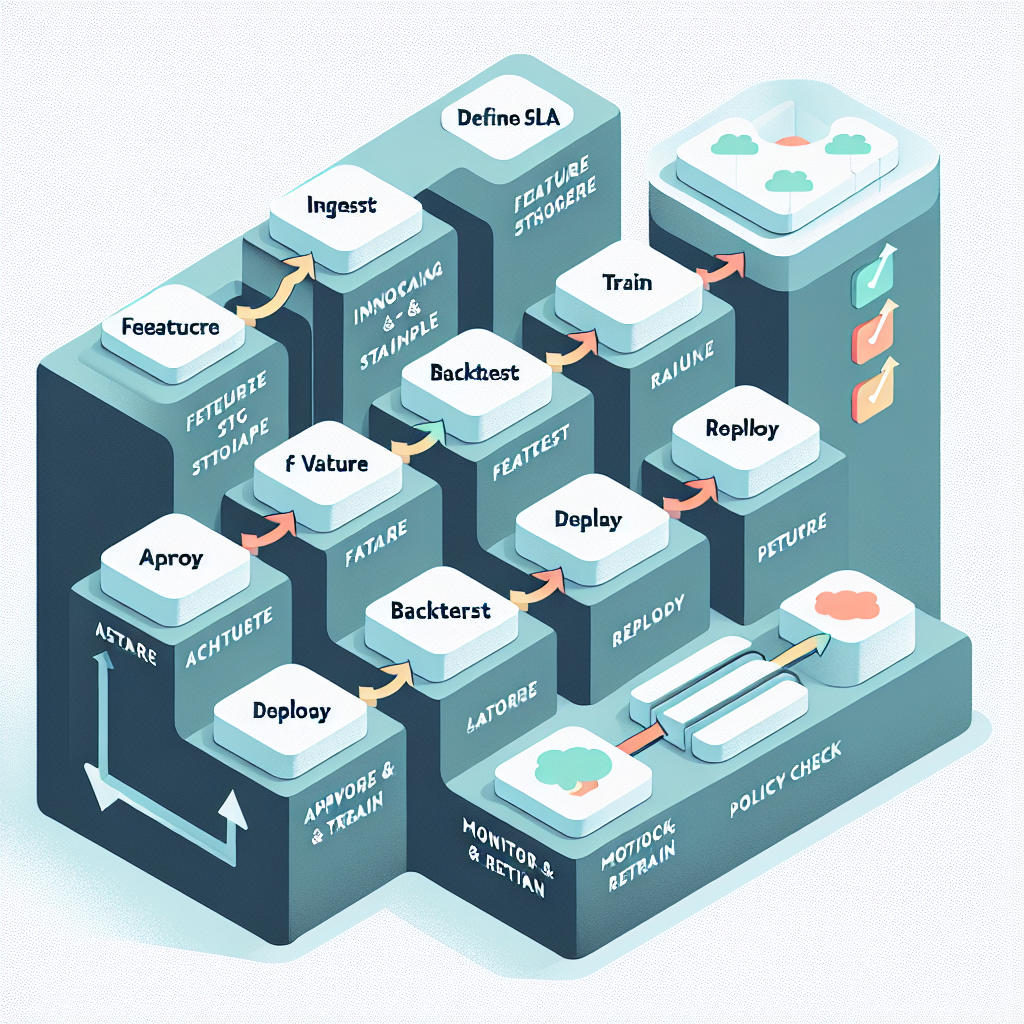
1) Define the decision and the guardrails
Start with the decision being supported, target metric, horizon, and latency budget. Establish SLAs (e.g., forecast refresh by 6 a.m., 99.5% availability), error thresholds, and cost ceilings. Document risk tier, approval workflow, and data access policies up front.
2) Ingest and validate data
Ingest from ERP/CRM, telemetry, events, and external feeds into a lake or lakehouse. Run schema checks, freshness rules, and anomaly screens (e.g., z-scores, seasonal decomposition). Quarantine failed batches; never silently pass bad data to training or scoring.
3) Build canonical features
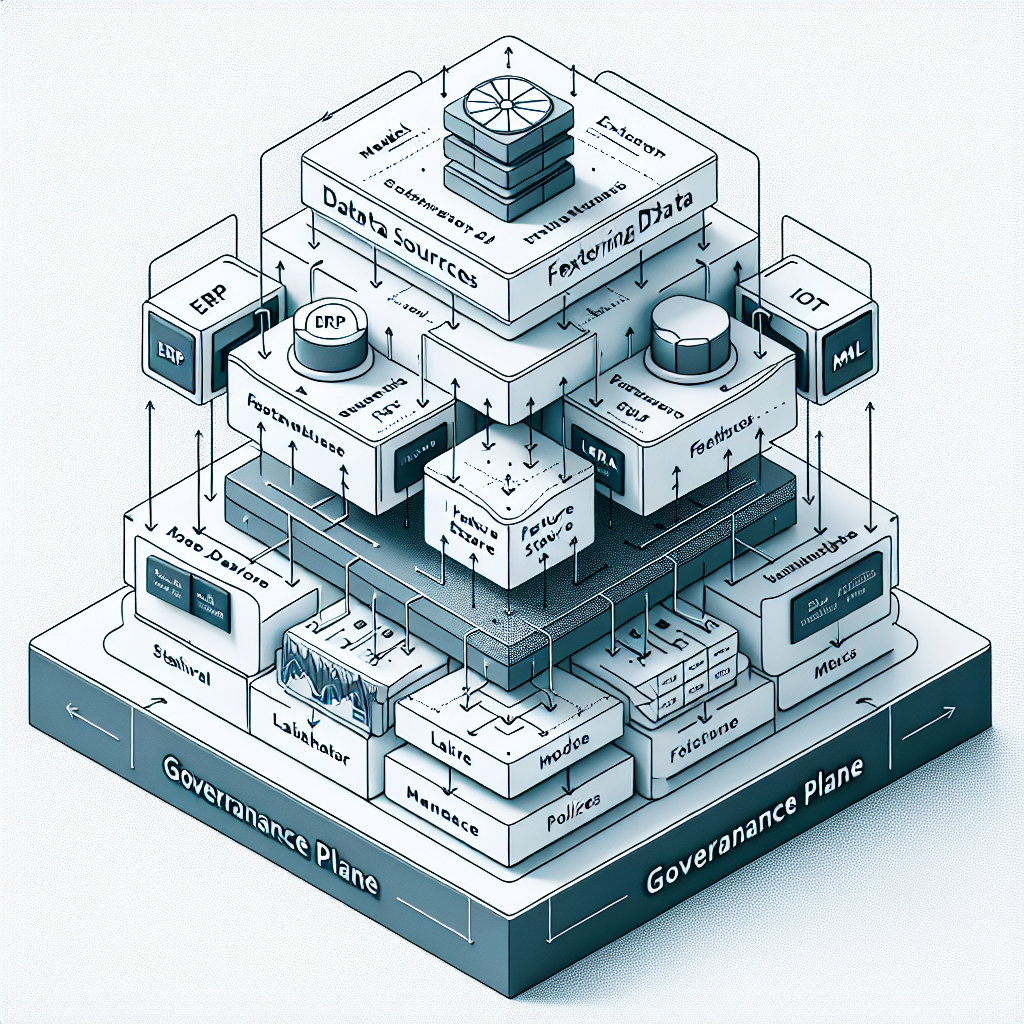
Create reusable, versioned features: calendars (holiday, promotions), lags and rolling stats, hierarchical keys, and external signals (prices, weather). Use a feature store to ensure training/serving consistency. For unstructured text, use embeddings to encode signals under clear provenance.
4) Train with controlled experimentation
Start with strong baselines (ARIMA/ETS), add tree-based models (XGBoost/LightGBM), then deep architectures (TFT, N-BEATS) where volume and nonlinearity justify it. Consider ensembles with weighted or stacking approaches. Use rolling-origin backtests and probabilistic metrics (pinball loss, CRPS) alongside MAE/MAPE. Track every run with datasets, features, code, and environment versions.
5) Evaluate, review, and approve
Use standardized scorecards: accuracy by horizon and hierarchy, calibration of intervals, stability under perturbations, and cost-of-error estimates. Route candidate models through approval gates based on risk tier; require sign-off for changes that affect financial reporting or critical operations.
6) Register and package
Package the model and metadata (metrics, training data fingerprint, feature schema) into a model registry. Publish a model card describing scope, assumptions, and known failure modes. Pin dependencies and containerize to ensure reproducibility.
7) Deploy by pattern
Choose batch jobs for long horizons and large hierarchies; use low-latency APIs or stream processors for short-horizon updates. Start new versions in shadow or canary mode. Maintain rollback policies and promote only after stability holds.
8) Monitor, alert, and retrain
Track service health (latency, availability), data drift (distribution shifts, feature anomalies), and forecast quality (MAE/MAPE, interval coverage) by hierarchy and horizon. Alert on thresholds tied to business impact. Trigger retraining on schedule and on drift, with guardrails to prevent churn.
9) Manage cost and capacity
Right-size compute, exploit autoscaling, and prefer CPUs for tree/statistical models; reserve GPUs only where deep models earn their keep. Cache features and avoid unnecessary re-materialization. Measure cost per forecast and optimize the heaviest steps first.
10) Continuously improve
Run postmortems after misses, track data defects back to owners, expand feature coverage deliberately, and prune over-complex models. Keep a change log, and resist changes that can’t show backtested improvement under the same evaluation protocol.
Tools and Technologies
Data and Storage
Object storage lake/lakehouse (e.g., S3/ADLS/GCS with catalog), columnar formats (Parquet), time-series optimized tables, plus time-series databases where appropriate.
Ingestion and Orchestration
Streaming (Kafka/Kinesis/Pub/Sub), batch ELT (dbt, Spark), workflow orchestration (Airflow, Dagster, Prefect). Use event-driven triggers for near-real-time updates.
Feature and Time-Series Layer
Feature stores (Feast, Tecton), calendar and holiday libraries, embeddings for text features, hierarchical reconciliation tooling (e.g., MinT methods) when required.
Modeling
Classical: ARIMA/SARIMA, ETS, Prophet. Machine learning: XGBoost, LightGBM, CatBoost. Deep learning: Temporal Fusion Transformer, N-BEATS, DeepAR. LLM utilities: embedding services for text signals or document extraction; avoid opaque forecasting via LLMs without evaluation.
Experiment and Registry
Experiment trackers and registries (MLflow, SageMaker, Vertex AI). Model cards, lineage capture, artifact stores, and environment pinning via containers.
Serving and Deployment
Batch jobs on schedulers, model servers for APIs, stream processors for online updates. Canary/shadow deploy, blue-green strategies, and rollbacks.
Observability
Metrics (Prometheus), dashboards (Grafana), logs and traces, data quality checks (Great Expectations/Deequ), drift detection, alerting.
Governance and Security
RBAC/ABAC, secrets management (KMS/Vault), policy-as-code, approval workflows, audit logs, PII handling, retention policies, model risk tiers.
FinOps
Cost attribution per pipeline, rightsizing, autoscaling policies, cache strategies, and periodic cost reviews tied to forecast value.
Examples and Applications
Inventory and demand: Forecast weekly SKU-level demand with holiday, promotion, and price features; hierarchical reconciliation ensures store and region totals match. Short latency updates on top sellers use a streaming layer; long-tail items run in batch overnight.
Capacity and staffing: Predict call volumes or site traffic by interval; schedule staffing with prediction intervals to cover peaks. Track cost of under/over-staffing and tune interval widths accordingly.
Maintenance and operations: Combine sensor-derived health features with usage patterns to predict failures; use forecasts to schedule maintenance without exceeding downtime SLAs.
Energy and infrastructure: Forecast load by zone with weather and event embeddings; enforce strict SLAs and continuous drift monitoring due to operational risk.
Financial planning: Cash flow and receivables with macro and customer behavior features; emphasize documentation, approvals, and audit trails due to compliance.
If you are starting out, favor a strong baseline plus clean pipelines and backtests over exotic models. At scale, invest in feature governance, registries, and deployment controls before incremental model gains—the stack-level reliability usually yields the largest performance lift.
Tables and Comparisons
Deployment patterns for ai forecasting vary by latency and governance needs. Choose deliberately.
Pattern When it fits Benefits Trade-offs Governance notes Batch Daily/weekly horizons; large hierarchies Cost-efficient, stable runs, easy rollback Not suitable for intraday shifts Straightforward approvals and audits Low-latency API Intra-day updates; user-facing decisions Responsive, fresh signals Higher ops burden and cost Requires tighter monitoring and change control Streaming Event-driven updates; short-horizon corrections Fast adaptation to changes Complex state management Strong lineage and replay policies needed
FAQ
Do I need deep learning for ai forecasting?
Not always. Start with well-regularized statistical and tree models; use deep architectures when you have large volumes, nonlinear seasonality, or many exogenous signals that simpler models cannot capture.
How often should I retrain?
Set a schedule aligned to drift and business cadence (e.g., weekly), plus triggers on detected data or error shifts. Retrain only when backtests show improvement under the same protocol.
Where do LLMs fit in this stack?
Use LLMs to structure unstructured inputs (e.g., categorizing events, extracting features) or to generate scenario narratives; keep core forecasts evaluated and governed with the same reproducibility and approval standards.
How do I handle hierarchies and aggregations?
Train at granular levels, then reconcile (bottom-up, top-down, or MinT) so that aggregates and details align. Monitor errors at each level and adjust weights accordingly.
How do I measure uncertainty correctly?
Produce prediction intervals via quantile forecasts and track coverage rates. Optimize with pinball loss and verify calibration across horizons and segments.
Conclusion
Reliable ai forecasting is an engineering and governance problem as much as a modeling one. With clean data contracts, versioned features, disciplined backtesting, registries, controlled deployment, and continuous monitoring, your forecasts become dependable services. The payoff is fewer fire drills, clearer accountability, and predictions that teams trust. Build the stack once, then scale it across use cases with confidence.